© Copyright American Meteorological Society 1995
Journal of Physical Oceanography: Vol. 27, No. 3, pp. 431–444.Existence and Formation Mechanism of the North Hawaiian Ridge Current
Bo Qiu, Deborah A. Koh, Claude Lumpkin, and Pierre Flament
Department of Oceanography, University of Hawaii at Manoa, Honolulu, Hawaii
(Manuscript received 15 April 1996, 5 August 1996)
ABSTRACT Available
surface drifter data are analyzed to determine the characteristics of the
North Hawaiian Ridge Current (NHRC) and its relation to the ocean circulation
around the Hawaiian waters. The NHRC is found to exist as a mean entity along
the coasts of the Hawaiian Islands. It originates as a northern branch of
westward moving interior flow and flows coherently along the islands at an
average speed of 0.10–0.15 m s
Available
surface drifter data are analyzed to determine the characteristics of the
North Hawaiian Ridge Current (NHRC) and its relation to the ocean circulation
around the Hawaiian waters. The NHRC is found to exist as a mean entity along
the coasts of the Hawaiian Islands. It originates as a northern branch of
westward moving interior flow and flows coherently along the islands at an
average speed of 0.10–0.15 m s 1.
The NHRC veers westward at the northern tip of the Hawaiian Islands, and
its subsequent path is not influenced by the presence of the submerged Hawaiian
Ridge. This finding does not support the theory that the NHRC is forced by
westward propagating, baroclinic Rossby waves reflecting off the Hawaiian
Ridge. Using a 2˝-layer reduced gravity model of the North Pacific, it is
shown that the mean NHRC is due primarily to the mean rather than the time-varying
wind forcing. The NHRC exists due to the imbalance between the interior Sverdrup
transport and the net southward transport, constrained by the presence of
the Hawaiian Islands. The path and transport of the observed NHRC are found
to be consistent with the flow pattern proposed by this theory.
1.
The NHRC veers westward at the northern tip of the Hawaiian Islands, and
its subsequent path is not influenced by the presence of the submerged Hawaiian
Ridge. This finding does not support the theory that the NHRC is forced by
westward propagating, baroclinic Rossby waves reflecting off the Hawaiian
Ridge. Using a 2˝-layer reduced gravity model of the North Pacific, it is
shown that the mean NHRC is due primarily to the mean rather than the time-varying
wind forcing. The NHRC exists due to the imbalance between the interior Sverdrup
transport and the net southward transport, constrained by the presence of
the Hawaiian Islands. The path and transport of the observed NHRC are found
to be consistent with the flow pattern proposed by this theory.
TABLE OF CONTENTS
[1. Introduction] [2. Analysis of...] [3. A circulation...] [4. Model results...] [5. Formation mechanism...] [6. Summary] [Appendix] [References] [Figures]
[Tables]
1. Introduction
The
Hawaiian Islands are part of the mostly submerged Hawaiian Ridge located
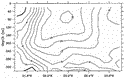
in the center of the subtropical gyre of the North Pacific Ocean (Fig. 1  ).
The Hawaiian Ridge is oriented in a nearly zonal direction and extends northwestward
for more than 2000 km from the island of Hawaii (20°N, 156°E) to the Midway
Islands (30°N, 180°). While a nearly continuous barrier below 2000 m, the
Hawaiian ridge is extremely porous above the 500-m depth (Roden 1991
). As depicted in Fig. 2 ,
it is only around the Hawaiian Islands, including the islands of Hawaii,
Maui, Molokai, Oahu, and Kauai, that the ridge extends near and above the
sea surface. Studies using historical hydrographic data (e.g., Emery and Dewar 1982
) show that the main thermocline around the Hawaiian Ridge is typically
300–400 m deep, suggesting that the Hawaiian Islands are the only closely
connected islands likely to interact directly with the wind-driven subtropical
gyre of the North Pacific.
).
The Hawaiian Ridge is oriented in a nearly zonal direction and extends northwestward
for more than 2000 km from the island of Hawaii (20°N, 156°E) to the Midway
Islands (30°N, 180°). While a nearly continuous barrier below 2000 m, the
Hawaiian ridge is extremely porous above the 500-m depth (Roden 1991
). As depicted in Fig. 2 ,
it is only around the Hawaiian Islands, including the islands of Hawaii,
Maui, Molokai, Oahu, and Kauai, that the ridge extends near and above the
sea surface. Studies using historical hydrographic data (e.g., Emery and Dewar 1982
) show that the main thermocline around the Hawaiian Ridge is typically
300–400 m deep, suggesting that the Hawaiian Islands are the only closely
connected islands likely to interact directly with the wind-driven subtropical
gyre of the North Pacific.
One
interesting feature observed around the Hawaiian Islands is the existence
of a northward flowing boundary current. The possible existence of such a
boundary current was first suggested by Mysak and Magaard (1983)
in their theory on the interaction between baroclinic Rossby waves
and island ridges. In accordance with this theory and by using Transpac XBT
data in the vicinity of the Hawaiian Islands, White (1983)
noted a narrow band of northwestward shear flow extending along the
ridge from 19.5° to 21.5°N. The band had a width of 75–100 km and a relatively
near-surface (100/400 dbar) speed of about 0.45 m s1. Mysak and Magaard (1983)
and White (1983)
named this northwestward current the North Hawaiian Ridge Current (NHRC).
The existence of this sheared northwestward boundary current was also observed by Roden (1980)
and by Talley and deSzoeke (1986)
based on closely spaced hydrographic casts. In the Talley and deSzoeke
study, they found that the maximum calculated geostrophic speeds were about
0.60 m s1. Because the
hydrographic surveys lacked alongridge information, it is not clear whether
the observed oscillations in dynamic topography are associated with closed
eddy circulations or with boundary currents flowing along the ridge. Talley and deSzoeke (1986)
argued for the latter on the basis of water mass properties.
A
renewed interest in the NHRC has emerged in recent years. Based on four densely
spaced XBT surveys northeast of the Hawaiian Islands, Price et al. (1994)
showed that the flow along the Hawaiian Ridge is dominated by an energetic
field of mesoscale eddies, with no clear evidence for a steady ridge current.
A similar conclusion is also reached by Bingham (1997)
in his analysis of high-resolution XBT sections from Honolulu to San
Fransisco; of eight available sections, only two indicated the northwestward
flow along the Hawaiian Islands. Interpreting dynamic slopes from individual
XBT transects, however, requires caution. Using repeated hydrographic casts
obtained at station ALOHA (22°45 N, 158°0W) from the Hawaii Ocean Time-series (HOT) cruises, Chiswell (1994)
showed that within a 36-hour time period, the near-surface dynamic
height values can vary up to 8 dyn cm due to energetic internal tides. This
value is about 30% of the annual range of the dynamic height values at this
station. Chiswell’s result demonstrates that long-term averaging of observational
data are needed in order to avoid aliasing by the internal tide signals.
N, 158°0W) from the Hawaii Ocean Time-series (HOT) cruises, Chiswell (1994)
showed that within a 36-hour time period, the near-surface dynamic
height values can vary up to 8 dyn cm due to energetic internal tides. This
value is about 30% of the annual range of the dynamic height values at this
station. Chiswell’s result demonstrates that long-term averaging of observational
data are needed in order to avoid aliasing by the internal tide signals.
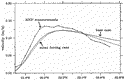
One long-term observation that reveals the NHRC existing as a mean current is recently made by Firing (1996)
based on repeated shipboard ADCP measurements from 32 HOT cruises over a 5-yr period (see Fig. 1 for the location of the repeat section). Figure 3
shows the vertical profile of the averaged alongridge velocity profile from
the ADCP measurements. The mean NHRC has a maximum core of 0.16 m s1
and its magnitude decreases significantly at 280 m, the level of the regional
sharp thermocline. The northwestward transport across this section (down
to 340 m) is 3.24 Sv (Sv  106 m3 s1)
and the alongsection transport is 0.42 Sv shoreward. As from the XBT observations,
the velocity vectors from the individual cruises are usually very noisy,
obscuring the presence of the mean NHRC (Firing 1996
).
106 m3 s1)
and the alongsection transport is 0.42 Sv shoreward. As from the XBT observations,
the velocity vectors from the individual cruises are usually very noisy,
obscuring the presence of the mean NHRC (Firing 1996
).
An early attempt to explain the existence of the NHRC, as we noted above, was put forth by Mysak and Magaard (1983)
. Using the potential vorticity equation, they showed that baroclinic
planetary waves, with westward propagating energy, would reflect on the northeast
side of the ridge, rectify with short reflected Rossby waves, and give rise
to a mean transport, in the form of bands of currents flowing in alternate
directions parallel to the ridge. This theory was later extended by Oh and Magaard (1984)
to include the effect of lateral friction and by Graef and Magaard (1994)
to include higher-order nonlinear effects. In all these theoretical
studies, the ridge has been assumed to extend above the sea surface and to
be infinitely long. As most of the Hawaiian Ridge, as we noted in Fig. 2 ,
exists below the permanent thermocline, the validity of this theory of wave
interaction in explaining the presence of the NHRC needs further investigation.
White and Walker (1985)
, on the other hand, postulated that the Hawaiian Ridge provides a western
boundary for the eastern Pacific basin, which intercepts the wind-driven
circulation by forming western-boundary-current-like flows along its northern
side. As the focus of their study was on the ridge’s influence upon the western
North Pacific, they provided no discussion to substantiate this postulation.
Our
present study has two objectives. The first objective is to clarify the horizontal
pattern of the mean NHRC through analysis of available surface drifter data.
Although many of the measurements mentioned above detected the NHRC along
several cross-ridge sections, a comprehensive picture of the mean NHRC, such
as where it originates, how coherent it is along the Hawaiian Ridge, and
where it terminates, is still lacking. Such a picture, as we will show in
subsequent sections, is crucial to verifying the formation mechanism for
the NHRC proposed in this study. The second objective of this study is to
understand the formation mechanism of the mean NHRC. By carrying out a series
of numerical experiments, we will address questions of what determines the
transport of the mean NHRC and how important the incident planetary waves
are in forming the mean NHRC.
It
is worth emphasizing that the interaction between the large-scale ocean circulation
and the isolated islands is not unique to the Hawaiian Islands. New Zealand
in the South Pacific Ocean and Madagascar in the Indian Ocean are other locations
where this interaction is likely to be important. Thus, a solid understanding
of the NHRC in the North Pacific Ocean will help to shed light on how this
interaction works in the other oceans as well.
The presentation of this study is organized as follows. In section 2,
we will start with a brief description of the analysis of surface drifter
data. This is followed by the presentation of a detailed horizontal picture
of the mean circulation around the Hawaiian Islands. Section 3 describes the North Pacific model used in this study. Details of the model results will be presented in section 4, with their verification being made through comparisons with available observations. In section 5,
we propose a formation mechanism for the NHRC within a simple theoretical
framework. This mechanism is found to be consistent with the available observations
and the model results. We will summarize the results from the present study
in section 6.
2. Analysis of surface drifter data
As
part of the WOCE Surface Velocity Program and NOAA the Pelagic Fisheries
Research Program, a large number of surface drifters were deployed in the
tropical and subtropical Pacific Ocean (Niiler et al. 1995
). These Lagrangian drifters consist of a fiberglass surface float containing
a satellite (ARGOS) transmitter, a subsurface float, and a drogue of diameter
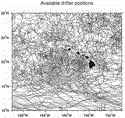
1 m and length 7 m, centered at 15-m depth. In this study, we compiled all
available satellite fixes in the region from 10° to 30°N, 180° to 130°W (see
Fig. 4 ).
Quality evaluation of the fixes was performed using the two-step scheme described by Hansen and Poulain (1996)
in which raw velocities are calculated by finite differencing between
each fix and “bad” values are defined as those outside a predetermined range.
For our study, we flagged fixes as “bad,” which resulted in a velocity beyond
four standard deviations from the median. Following this quality check procedure,
the irregularly spaced fixes were interpolated to 1/4-day intervals using
the kriging method (Hansen and Herman 1989
). A detailed description on applying this method to our drifter dataset is included in the appendix.
The
set of interpolated positions in the Hawaiian Island region spanned the period
from 1986 to 1996 and contained a total of 165.7 drifter-years. Currents
halfway between each pair of positions were estimated by finite differencing.
The mean and variance of the currents were then calculated on a 0.5° by 0.5°
grid, with all observations equally weighted in a smoothing window of size
3° zonally by 1° meridionally centered at each grid point. To reduce the
noise in poorly sampled areas, currents were not estimated at grid points
where less than 100 drifter-days of data fell within the smoothing window.
Mean currents were also not estimated where the median zonal and meridional
currents were not significantly different from zero at the 90% confidence
level, assuming a Student’s t distribution to the drifter-derived velocities.
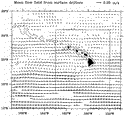
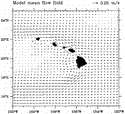
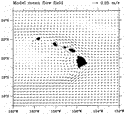
Figure 5 shows the drifter-derived mean flow field. Currents exceeding 0.25 m s1
are found in the North Equatorial Current (NEC) south of the Hawaiian Islands.
At 13°N, the average speed of the NEC is 0.17 m s1.
Between 18° and 22°N, the NEC is strongly influenced by the Hawaiian Islands.
In this region, southwestward propagating anticyclonic eddies, clearly visible
in individual drifter tracks, intensify the NEC and increase the variance
(Mitchum 1995
). In the lee of the islands, two elongated gyres appear, separated
by a countercurrent at 19°N extending from 170° to 158°W, which we call the
Hawaiian Lee Counter Current (HLCC). By inspecting individual drifter tracks,
this cyclonic/anticyclonic gyre pair appears to be formed by the superposition
of westward propagating eddies generated in the lee of the Hawaiian Islands.
East
of the Hawaiian Islands, the impinging NEC flows due westward. This impinging
flow bifurcates east of the island of Hawaii, with a branch of the current—the
NHRC—continuing northwestward along the island ridge. The NHRC averages 0.08
to 0.12 m s1, with maximum currents of O(0.15–0.20 m s1).
The width of the NHRC is approximately 100 km. The ridge current appears
to veer westward northwest of the island of Kauai, passing over the submerged
Hawaiian Ridge (the dashed contours in Fig. 5 denote the 2000-m isobaths).
The circulation pattern derived from the drifter data in Fig. 5
suggests that the NHRC has its origin in the interior westward inflow. It
is coherent along the Hawaiian Islands, but appears to be less influenced
by the submerged Hawaiian Ridge north of 23°N. This latter result is consistent
with the notion that the Hawaiian Ridge there exists mostly below the permanent
thermocline (Fig. 2 )
and does not act as an effective, solid barrier to the mean NHRC. As such,
previous theories regarding the Hawaiian Ridge as a solid barrier and the
NHRC as a continuous current along the ridge may need modification.
3. A circulation model of the North Pacific
To
understand the formation of the NHRC, we adopt in this study a 2˝-layer,
reduced gravity model that covers the tropical and subtropical oceans in
the North Pacific. Though simple in its formulation, the 2˝-layer reduced
gravity model is suitable to study the interior wind-driven circulation and
the propagation of baroclinic Rossby waves (McCreary and Lu 1994
). As we noted in the introduction, these dynamics are most likely essential
in the interaction of the Hawaiian Islands with the interior subtropical
circulation.
In
the 2˝-layer reduced-gravity system (which assumes the third layer is inert),
equations governing the upper two layers of the ocean can be written as follows:
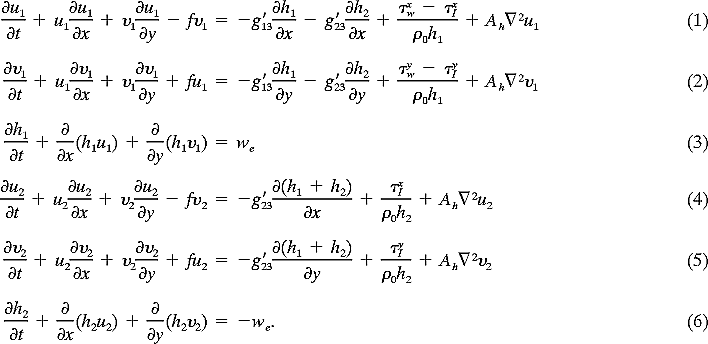
In the above equations, (ui,  i) are the velocity components in the (x, y) directions in the ith layer, hi is the ith layer thickness,
  2 the horizontal Laplacian operator, Ah the coefficient of the horizontal eddy viscosity, and
  o the reference water density. The Coriolis parameter f = 2
 sin
sin , where is the earth rotation rate and the latitude. The reduced gravity between the ith and jth layers is gij = (j i)g/0, and (
 xw, yw) are the (x, y) components of the surface wind stresses. Following O’Brien and Hurlburt (1972)
, the interfacial shear stresses are given by
xw, yw) are the (x, y) components of the surface wind stresses. Following O’Brien and Hurlburt (1972)
, the interfacial shear stresses are given by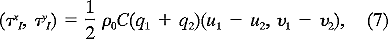
where qi = (u2i +u2i)1/2 and C is the interfacial drag coefficient (C = 5 × 10⁴). In the continuity equations (3) and (6), we
denotes the entrainment velocity. The numerical treatment for the entrainment,
which takes place when the upper-layer thickness becomes shallower than 80
m, follows that described in McCreary and Lu (1994)
.To
avoid artificially specifying boundary values, the model domain is chosen
to include the entire tropical and subtropical circulations in the North
Pacific. It is bounded to the west by the Asian continent (120°E) and to
the east by the North American continent (75°W). Meridionally, the domain
extends from the equator to 38°N. Although the northern and southern boundaries
are open, we expect the effects of these open boundaries to be insignificant
on the dynamics around the Hawaiian Islands as the model domain reaches from
the southern limit of the tropical gyre to the northern limit of the subtropical
gyre.
Equations (1)–(6) are solved in finite difference form using the energy-conserving scheme proposed by Sadourney (1975)
. The Arakawa C-grid is used in defining the staggered positions for the dependent variables ui, i, and hi (Arakawa and Lamb 1977
). Along the model’s open boundaries, no-normal flow and free-slip conditions
are used. No-normal flow and non-slip conditions are used along the coast
or marginal seas (depth < 200 m). To focus on the NHRC, the model grid
has at its finest a meridional resolution of 1/12° latitude and a zonal resolution
of 1/10° longitude around the Hawaiian Islands, and the grid size decreases
gradually away from the islands to 0.5° in latitude and 1° in longitude at
the model boundary regions.
The
following two criteria are considered in choosing the mean thickness and
density values for the 2˝-layer system. First, we require that the modeled
surface layer, which is under direct influence of surface wind, has a depth
structure matching the observed 26.0  surface. According to Huang and Qiu (1994)
, this isopycnal surface is the densest surface that outcrops in the
subtropical North Pacific. Second, we require that the first-mode baroclinic
Rossby waves in the model propagate at speeds similar to those inferred from
XBT and satellite altimetry observations (e.g., Kessler 1990
; Van Woert and Price 1993
; Mitchum 1995
). The values chosen based on these two criteria are h10 = 230 m, h20 = 370 m, g13 = 0.0353 m s2, and g23 = 0.0118 m s2. In the whole model domain, the horizontal eddy viscosity coefficient is 500 m2 s1 except near the northern boundary where Ah is increased linearly to 1500 m2 sl from 30° to 38°N. The increased Ah value is used to suppress instabilities occurring in the Kuroshio/Kuroshio Extension regions.
surface. According to Huang and Qiu (1994)
, this isopycnal surface is the densest surface that outcrops in the
subtropical North Pacific. Second, we require that the first-mode baroclinic
Rossby waves in the model propagate at speeds similar to those inferred from
XBT and satellite altimetry observations (e.g., Kessler 1990
; Van Woert and Price 1993
; Mitchum 1995
). The values chosen based on these two criteria are h10 = 230 m, h20 = 370 m, g13 = 0.0353 m s2, and g23 = 0.0118 m s2. In the whole model domain, the horizontal eddy viscosity coefficient is 500 m2 s1 except near the northern boundary where Ah is increased linearly to 1500 m2 sl from 30° to 38°N. The increased Ah value is used to suppress instabilities occurring in the Kuroshio/Kuroshio Extension regions.
The model ocean, which was initially at rest, was spun up by the monthly climatological wind of Hellerman and Rosenstein (1983)
. In addition to this base case (i.e., the time-varying forcing case),
we also ran a case in which the model ocean is forced by the annually averaged
Hellerman and Rosenstein wind (the mean forcing case). In both cases, the
annually averaged height and flow fields reached quasi-steady state after
12 years of model integration. All our following analyses will be based on
the model output from the 13th year.
4. Model results and their implication
Before
discussing circulation in the region of interest, it is important to verify
the model’s representation of basin-scale circulation features. Figure 6a
shows the annually averaged upper-layer thickness field derived from the
base model case. For comparison, the upper-layer thickness inferred from
the Levitus (1982)
climatological dataset is shown in Fig. 6b .
The model result appears to simulate quite well the large-scale pattern of
the observed upper-layer thickness field. The largest discrepancy between
the two figures occurs in the Kuroshio Extension region where the width of
the boundary current extension is unrealistically broadened by the increased
eddy viscosity coefficient along the model’s northern boundary. To the east
of the Hawaiian Ridge, the agreement between the model and the observations
is, in general, very favorable; for example, the isolines of the upper-layer
thickness east of the Hawaiian Islands bear the similar impinging angles
and gradients. This favorable agreement is important because a realistic
basin-scale circulation is the prerequisite for our following discussion
of the regional current patterns around the Hawaiian Islands.
Figure 7
shows the detailed upper-layer circulation pattern from the base model case
in the vicinity of the Hawaiian Islands. Similar to the observations shown
in Fig. 5 ,
the mean inflow east of the Hawaiian Islands is nearly due westward. This
inflow bifurcates east of the Big Island, joining the North Equatorial Current
as its southern branch and the NHRC, its northern branch. The modeled NHRC
eventually veers and continues westward north of the island of Kauai, a result
also suggested by the surface drifter data. The overall strength of the circulation
in the model is about 20%–30% weaker than in Fig. 5 This is likely because the surface drifter data represent the near-surface flows, whereas Fig. 7 gives the averaged flow pattern in the upper thermocline, which has a depth 250–300 m in this region (Fig. 6a ).
As
the circulation pattern inferred from the surface drifter data does not resolve
the cross-stream profile of the mean NHRC, a more detailed comparison is
made along the transect of the HOT cruises where multiyear ADCP data are
available (Firing 1996
). Using the ADCP result shown in Fig. 3 ,
we average the cross-transect velocities in the upper 280 m, a depth corresponding
to the modeled upper-layer thickness in this region. The result is plotted
in Fig. 8 with crosses. The solid line in Fig. 8
shows the cross-transect velocity profile derived from the model. Clearly,
both the magnitude and the velocity profile of the modeled mean NHRC match
well the densely sampled ADCP result.
In
contrast with the east of the Hawaiian Islands, the present model is less
successful simulating the circulation leeward of the islands. The mean flow
there is generally more quiescent in the model than obtained from the surface
drifter data (Fig. 5 ). The eastward HLCC, which exists in Fig. 5
in the band of 19°–20°N, is absent in the modeled mean flow field. This discrepancy
may not be fully explained, as we noted above, by the near-surface nature
of the surface drifter data. A possibly more important factor is the regional
wind forcing in the lee of the Hawaiian Islands. Because the Hawaiian Islands
extend into the lower troposphere, the trade winds around the islands form
distinct shear layers at the northern and southern boundaries of each island.
These wind shears tend to generate mesoscale eddies on the lee side of the
Hawaiian Islands (Patzert 1969
), and the westward translation of these eddies are possibly the cause
for the observed eastward mean flow in the lee of the Big Island, Hawaii.
This regional wind effect is not included in the climatological wind data
of Hellerman and Rosenstein (1983)
. As the focus of this study is on the NHRC, this problem associated
with the leeward wind forcing will be left to future studies.
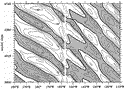
In
this case forced by the monthly varying surface wind, annual baroclinic Rossby
waves are continuously excited along the North America coast as well as in
the interior ocean (see Fig. 9 ).
It is worth checking if the energy level of these modeled waves matches that
in the real ocean. To do so, we computed the root-mean-squared (rms) sea
surface height anomalies from the model output (Fig. 10a ). In the region between the North American coast and the Hawaiian Islands, typical values of the rms anomalies are O(0.02–0.03 m). From Fig. 9 , it is clear that the anomalies are mostly due to the propagation of annual baroclinic Rossby waves. For comparison, Fig. 10b
shows the rms sea surface height anomalies derived from the first 3-year
TOPEX/POSEIDON altimeter data (Oct 1992–Sep 1995). In the interior ocean
east of the Hawaiian Islands, the rms anomalies are O (0.04–0.06 m),
which are twice as large as the model result. As far as the annual baroclinic
Rossby waves are concerned, the difference between the two results are possibly
exaggerated because the altimeter data contains the sea surface height signals
other than annual baroclinic waves. In fact, the analysis of XBT data by
Kang and Magaard (1980)
showed that the sea surface height amplitude associated with the annual
baroclinic Rossby waves is in the range of this study (see their Fig. 9 ).
Given these comparisons, it is reasonable to assume that the amplitudes of
the westward propagating, annual Rossby waves are not overly underestimated
in the model.
In light of the Mysak and Magaard (1983)
theory that emphasized the roles of the annual baroclinic Rossby waves,
a question arising naturally is how important are these waves in forming
the mean circulation around the Hawaiian Islands. To address this question,
we conduct a companion model run in which the model ocean is forced throughout
by the annually averaged Hellerman and Rosenstein (1983)
wind data. In this mean forcing case, the rms sea surface height anomalies are on the order of 103 m (see Fig. 10c ), indicating the absence of recognizable baroclinic Rossby waves. Figure 11
shows the upper-layer circulation pattern derived from this mean forcing
case; surprisingly, it displays a mean flow pattern very similar to that
of the time-varying forcing case (Fig. 7 ).
In fact, comparing the velocity profiles of the mean NHRC along the ADCP
section gives almost identical results from the two model runs (see the dashed
and the solid lines in Fig. 8 ).
Given
the fact that the model simulation reproduces many observed features of the
mean NHRC and assuming this agreement is not coincidental, the result from
the above model runs suggests that the time-varying wind forcing and its
resultant planetary wave motions are not essential in forming the mean NHRC.
5. Formation mechanism of the NHRC
What
physics are then responsible for the formation of the mean NHRC? In addition,
what determines the volume transport of the NHRC, estimated at 3.24 Sv from
the long-term ADCP observations (Fig. 3 )?
Because the time-dependent dynamics are not essential in this problem, as
discussed in the last section, some insights can be gained by considering
the “Island Rule” of Godfrey (1989)
, a theory applicable to the steady and large-scale wind-driven circulation.
When
an island exists in steady ocean circulation, mass conservation requires
that the meridional transport across individual zonal sections between the
island and the ocean’s eastern boundary be constant. As detailed by Godfrey (1989)
, this constant transport, To, is solely determined
by the surface wind stress values along the contour that circulates the western
flanks of the island and the eastern boundary, and along the latitudes of
the island’s northern and southern tips. Put mathematically, the island rule
states
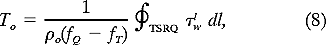
where l denotes the line segment along the integral contour,lw is the tangential wind stress along the contour, and fQ and fT are the Coriolis parameters at the latitudes of the island’s northern and southern tips, respectively.In
applying Godfrey’s island rule to the model, we assume that the Hawaiian
Islands extending from Hawaii to Kauai act as a single island. This assumption
is justifiable as the meridional scale of all the channels among the islands
is no wider than the boundary current width and the modeled through-channel
flows are very weak (see Fig. 7 ). The dashed line in Fig. 12 shows the relevant, integral contour estimating To. Notice that the total transport To east of the islands comprises two components: an interior Sverdrup flow and a western boundary current;
To = TSverdrup + TWBC. (9)
As defined in (8), To is a global quantity that depends upon the surface wind along the integral contour TSRQ. The interior Sverdrup transport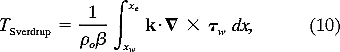
on the other hand, depends on the latitude under consideration. In (10),  is the y derivative of the Coriolis parameter, xe the longitudinal position of the eastern boundary, and xw the offshore edge of the western boundary current. Along individual zonal sections, Eq. (9) implies that the mass flux imbalance between To and the latitude-dependent TSverdrup is compensated by the existence of a western boundary current.
To assess this idea quantitatively, we calculate To and the TSverdrup
value along 21.7°N using the annually averaged Hellerman and Rosenstein wind
data. This latitude is chosen because the boundary current transport there
has been directly measured by ADCPs (Firing 1996
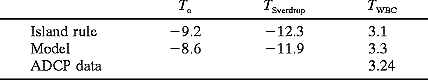
). The result, summarized in Table 1 ,
suggests that a compensating northward boundary current with a magnitude
of 3.1 Sv is needed to close the mass balance along this latitude. This transport
value agrees well with the ADCP measurements of 3.24 Sv.
Using the model data along 21.7°N (Fig. 13 ),
we can also directly estimate the total meridional transport and the transport
partitioning between the interior Sverdrup flow and the western boundary
current. The result, presented in the second row of Table 1 ,
reveals that the model values are generally within the 90% range of those
predicted by the island rule theory. That the modeled interior Sverdrup flow
matches well with the estimation using Eq. (10) is also consistent with the recent study by Hautala et al. (1994)
, who showed that the observed interior southward transport in the subtropical
North Pacific is in Sverdrup balance. The modeled western boundary current
along 21.7°N is 3.3 Sv, again agreeing favorably with the ADCP measurements.
The agreement between the model and the simple theory shown in Table 1 suggests that the mean NHRC behaves as a western boundary current, as previously suggested by White and Walker (1985)
. The existence of the NHRC owes to the imbalance between the interior
Sverdrup transport and the southward transport that is regulated by the island
rule due to the presence of the Hawaiian Islands within the subtropical circulation
of the North Pacific. It is worth noting that the Godfrey’s island rule has
been previously shown by de Szoeke (1987)
to explain well the mean ocean circulation around New Zealand in the South Pacific Ocean.
6. Summary
The
objective of this study has been to characterize and understand the nature
of the ocean circulation around the Hawaiian waters. Our focus has been on
the existence and formation mechanisms of a boundary current flowing northwestward
along the island ridge: the North Hawaiian Ridge Current. Although the presence
of the NHRC has been recognized by many previous investigators since it was
named by White (1983)
and Mysak and Magaard (1983)
, a comprehensive picture regarding the NHRC as part of the ocean circulation
around the Hawaiian waters was lacking. One of the goals of this study was
to construct such a picture in order to fully understand the dynamics underlying
the NHRC.
By
compiling and analyzing the available surface drifter data in the Hawaiian
waters, we found that the NHRC does exist as a mean entity along the northeast
coasts of the Hawaiian Islands. It has an average speed of 0.10–0.15 m s1 and a width O(100km); this result is consistent with the picture of the mean NHRC obtained by Firing (1996)
based on multiyear ADCP measurements north of the island of Oahu. The
result of the drifter data further reveals that the NHRC is the northern
branch of a westward moving interior flow, which bifurcates east of the Big
Island. The NHRC flows coherently along the Hawaiian Islands and seems to
continue as a westward flowing current northwest of the island of Kauai.
The presence of the submerged Hawaiian Ridge north of 23°N does not appear
to exert a strong influence upon the path of the NHRC after it detaches from
the islands. This is likely because the permanent thermocline in this region
exists shallower than the ridge topography. (To this end, the “North Hawaiian
Island Current” may be a more suitable name for the NHRC.)
The flow pattern derived from the surface drifter data does not support the theoretical findings of Mysak and Magaard (1983)
; in their theory, the geographically long Hawaiian Ridge is regarded
as a solid barrier reflecting the westward propagating, first-mode baroclinic
Rossby waves and the NHRC, a rectified mean current along the long Hawaiian
Ridge. Our study suggests that along the Hawaiian Ridge system, the Hawaiian
Islands are the only effective barrier for the surface-intensified baroclinic
Rossby waves. As the length of the Hawaiian Islands is only comparable to
the wavelengths of the incident baroclinic Rossby waves, the wave rectification
mechanism is likely to be less effective in generating rectified boundary
flows.
To
examine the formation mechanisms for the NHRC, we used in this study a 2˝-layer
reduced-gravity North Pacific basin model with variable spatial resolution
that focuses on the Hawaiian waters. The model is solely wind forced, using
variations of Hellerman and Rosenstein’s (1983)
monthly climatological winds. By and large, the model successfully
simulated the observed features of the mean NHRC: its source water, its transport
value, and its paths both along the island chain and thereafter. One important
outcome from the modeling work is that the mean NHRC is due primarily to
the mean rather than to the time-varying wind forcing. The presence of the
first-mode baroclinic Rossby waves has a very weak effect in changing the
flow pattern of the mean NHRC.
With this model result in mind, we applied the steady circulation theory of Godfrey (1989)
. It is argued that the mean NHRC exists due to the mass imbalance between
the latitudinally dependent interior Sverdrup flow and the net meridional
flow constrained by the presence of the Hawaiian Islands. The net meridional
transport is a large-scale quantity as determined by the Godfrey’s island
rule. This proposed formation mechanism for the NHRC explains well the model
results; more importantly, it is consistent with the observational results
available to us around the Hawaiian waters. Finally, the focus of the present
study has been on the formation mechanism of the mean NHRC. As we
noted in the introduction, fluctuations on monthly to interannual timescales
are commonly observed in the NHRC. Future studies are needed to unravel the
time-dependent nature of this boundary current.
Acknowledgments.
This study benefited from many insightful discussions with Eric Firing, Dennis
Moore, Lorenz Magaard, and Fred Bingham. Comments made by Doug Luther and
the two reviewers helped improve an earlier version of the manuscript. The
long-term ADCP result presented in Fig. 3
was generously provided to us by Eric Firing through the Hawaiian Ocean Timeseries
(HOT) program. We are grateful for the support by NSF through Grant OCE94-03048
and by NOAA through Cooperative Agreement NA37RJ0199. The HOT program was
supported by NSF Grant OCE93-03094. Supercomputer time for the modeling work
was provided by the Maui High Performance Computer Center, Maui, Hawaii.
APPENDIX
Interpolation by the Kriging Method
The kriging method of Hansen and Herman (1989)
is used in this study to interpolate the irregularly spaced satellite fixes to a regular grid. In this method, the vector x containing irregularly sampled latitude or longitude fixes (treated independently) is considered to contain a true signal  plus measurement noise
  :
:
x(ti) = xi =  i + i. (A1)
The noise is assumed to be uncorrelated with itself and , with a zero mean and fixed variance  e2
e2 :
: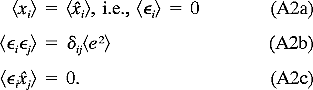
An estimate *o of at time to is constructed as*o = wixi, (A3)
where the repeated index implies a sum over i from 1 to n (n = 10 in our interpolations), and the weights w are chosen such that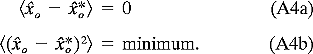
Condition (A4a) constrains the weights such that
while condition (A4b) requires minimizing
To do this, one needs the autocorrelation function ij. The approach taken by Hansen and Herman (1989)
is to assume knowledge of a structure function  ij,
ij,
In terms of Sij, the error 2k is2k = 2wioi wiwjij + e2 wiwi. (A8)
By minimizing 2k with respect to the weights, one finds thatwjij wi e2 +  = oi, (A9)
where is an unknown Lagrange multiplier introduced to incorporate constraint (A4a). This result may be multiplied by  iwi (=1) to find2k = wioi + . (A10)
Equation (A9) consists of n equations and n + 1 unknowns (counting ). One may eliminate from this set of equations by subtracting each ith equation from the (i 1)th equation. With inclusion of condition (A4a), one is left with a set of n equations and n unknowns, and may solve for the interpolation weights.After applying this interpolation technique to 6.5 years of drifter data from the tropical Pacific Ocean, Hansen and Poulain (1996)
derived generic structure functions for the tropical Pacific Ocean. They used the fractional Brownian motion function
ij =  |ti tj|, (A11)
for which = 1 models pure Brownian motion and = 2 results in strictly linear motion. For the north tropical Pacific Ocean, Hansen and Poulain found optimal values for and of
We used these first-guess values for and and adjusted them in a second iterative step, which minimized the variance between observed and interpolated points (Hansen and Poulain 1996
). Values for e2
were estimated from a 70-day time series of fixes for a stationary (undeployed)
drifter. During this period, 58 fixes were provided by service ARGOS; standard
deviations of the fixes were 2.44 × 10³ ° in latitude and 6.08 × 10³ ° in longitude.
REFERENCES
Arakawa, A., and V. R. Lamb, 1977: Computational design of the basic dynamical processes of the UCLA general circulation model. Methods Comput. Phys., 17, 173–265.
Bingham, F. M., 1997: Evidence for the existence of a North Hawaiian Ridge Current. J. Phys. Oceanogr.,
Chiswell, S. M., 1994: Vertical structure of the baroclinic tides in the central North Pacific subtropical gyre. J. Phys. Oceanogr., 24, 2032–2039.
de Szoeke, R. A., 1987: On the wind-driven circulation of the South Pacific Ocean. J. Phys. Oceanogr., 17, 613–630.
Emery, W. J., and J. S. Dewar, 1982:
Mean temperature–salinity, salinity–depth, and temperature–depth curves for
the North Atlantic and the North Pacific. Progress in Oceanography, Vol. 11, Pergamon, 219–305.
Firing, E., 1996: Currents observed north of Oahu during the first five years of HOT. Deep-Sea Res., 43, 281–303.
Godfrey, J. S., 1989: A Sverdrup model of the depth-integrated flow for the world ocean allowing for island circulations. Geophys. Astrophys. Fluid Dyn., 45, 89–112.
Graef, F., and L. Magaard, 1994: Reflection of nonlinear baroclinic Rossby waves and the driving of secondary mean flows. J. Phys. Oceanogr., 24, 1867–1894.
Hansen, D. V., and A. Herman, 1989: Temporal sampling requirements for surface drifting buoys in the tropical Pacific. J. Atmos. Oceanic Technol., 6, 599–607.
——, and P.-M. Poulain, 1996: Quality control and interpolations of WOCE/TOGA drifter data. J. Atmos. Oceanic Technol., 13, 900–909.
Hautala, S. L., D. H. Roemmich, and W. J. Schmitz, 1994: Is the North Pacific in Sverdrup balance along 24°N? J. Geophys. Res., 99, 16 041–16 052.
Hellerman, S., and M. Rosenstein, 1983: Normal monthly wind stress over the world ocean with error estimates. J. Phys. Oceanogr., 13, 1093–1104.
Huang, R. X., and B. Qiu, 1994: Three-dimensional structure of the wind-driven circulation in the subtropical North Pacific. J. Phys. Oceanogr., 24, 1608–1622.
Kang, Y. Q., and L. Magaard, 1980: Annual baroclinic Rossby waves in the central North Pacific. J. Phys. Oceanogr., 10, 1159–1167.
Kessler, W. S., 1990: Observations of long Rossby waves in the northern tropical Pacific. J. Geophys. Res., 95, 5183–5217.
Levitus, S., 1982: Climatological Atlas of the World Ocean. NOAA Prof. Paper No. 13, U.S. Govt. Printing Office, 173 pp.
McCreary, J. P., and P. Lu, 1994: On the interaction between the subtropical and the equatorial oceans: The subtropical cell. J. Phys. Oceanogr., 24, 466–497.
Mitchum, G. T., 1995: The source of 90–day oscillations at Wake Island. J. Geophys. Res., 100, 2459–2475.
Mysak, L. A., and L. Magaard, 1983:
Rossby wave driven eulerian mean flows along non-zonal barriers, with application
to the Hawaiian Ridge. J. Phys. Oceanogr., 13, 1716–1725.
Niiler, P. P., A. S. Sybrandy, K.
Bi, P. M. Poulain, and D. Bitterman, 1995: Measurements of the water-following
capability of holey-sock and TRISTAR drifters. Deep-Sea Res., 42, 1951–1964.
O’Brien, J. J., and H. E. Hurlburt, 1972: A numerical model of coastal upwelling. J. Phys. Oceanogr., 2, 14–26.
Oh, I. S., and L. Magaard, 1984: Rossby wave-induced secondary flows near barriers, with application to the Hawaiian ridge. J. Phys. Oceanogr., 14, 1510–1513.
Patzert, W. C., 1969: Eddies in Hawaiian waters. HIG 69-8, Hawaii Institute of Geophysics, 51 pp.
Price, J. M., M. L. Van Woert, and M. Vitousek, 1994: On the possibility of a ridge current along the Hawaiian Islands. J. Geophys. Res., 99, 14 101–14 111.
Qiu, B., 1995: Variability and energetics
of the Kuroshio Extension and its recirculation gyre from the first two-year
TOPEX data. J. Phys. Oceanogr., 25, 1827–1842.
Roden, G. I., 1980: On the subtropical frontal zone north of Hawaii during winter. J. Phys. Oceanogr., 10, 342–362.
——, 1991: Effects of the Hawaiian ridge upon oceanic flow and thermohaline structure. Deep-Sea Res., 38, S623–S654.
Sadourney, R., 1975: The dynamics of finite-difference models of the shallow-water equations. J. Atmos. Sci., 32, 680–689.
Talley, L. D., and R. A. deSzoeke, 1986: Spatial fluctuations north of the Hawaiian Ridge. J. Phys. Oceanogr., 16, 981–984.
Van Woert, M. L., and J. M. Price,
1993: Geosat and Advanced Very High Resolution Radiometer observations of
oceanic planetary waves adjacent to the Hawaiian Islands. J. Geophys. Res., 98, 14 619–14 631.
White, W., 1983: A narrow boundary current along the eastern side of the Hawaiian Ridge: The north Hawaiian Ridge current. J. Phys. Oceanogr., 13, 1726–1731.
——, and A. E. Walker, 1985: The influence
of the Hawaiian Archipelago upon the wind-driven subtropical gyre in the
western North Pacific. J. Geophys. Res., 90, 7061–7074.
Figures
Click on thumbnail for full-sized image.
Fig.
1. Bottom topography in the vicinity of the Hawaiian Ridge (based on NOAA’s
ETOP05 dataset). Dashed contours denote the 2000-m and 4000-m isobaths, and
solid contours, the 500-m isobaths. The Hawaiian Islands include (denoted
in the map from west to east) the islands of Kauai, Oahu, Molokai, Maui,
and Hawaii (a.k.a. the Big Island). The solid line north of Oahu denotes
the ADCP transect of the HOT cruises.
Click on thumbnail for full-sized image.
Fig.
2. Height profile (in meters) of the Hawaiian Ridge as a function of latitude
from 20.5° to 29.0°N. Here the height is defined as the highest point along
the ridge. The dashed line at 300–400 m indicates the typical thermocline
depth in this region.
Click on thumbnail for full-sized image.
Fig.
3. Cross-track velocity profile averaged from E. Firing’s 5-year ADCP measurements
(1988–93). The transect is located north of the island of Oahu, as indicated
in Fig. 1 .
Positive velocity represents northwestward flow. Numbers of independent measurements
used in deriving this profile are 50–70 above the 250-m depth but decrease
to 10–20 at the 340-m depth.
Click on thumbnail for full-sized image.
Fig.
4. Spaghetti diagram of the interpolated drifter positions in the Hawaiian
Island region. Raw satellite (ARGOS) fixes from 1989 to 1996 are interpolated
at 1/4-day intervals using the kriging method. The high density of observations
in the lee of Hawaii corresponds to drifter releases of the Pelagic Fisheries
Research Program and are among the most recent tracks. Note the sparsity
of data in some areas, such as in parts of the NEC and along the island ridge
northwest of the Hawaiian Islands.
Click on thumbnail for full-sized image.
Fig. 5. Mean flow pattern derived from available surface drifter data shown in Fig. 4 .
Current vectors are estimated on a 0.5° × 0.5° grid; no estimation is made
(in blank areas) where the mean flow is either undersampled or not significantly
different from zero at the 90% confidence level. The dashed box denotes the
area where detailed comparisons with model results are made. Dashed contours
denote the 2000-m isobaths.
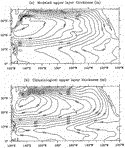
Click on thumbnail for full-sized image.
Fig. 6. (a) Annually averaged upper-layer thickness field from the base model run. (b) Depth of the upper layer above the 26.0 surface based on the Levitus (1982)
climatology.
Click on thumbnail for full-sized image.
Fig.
7. Annually averaged surface layer flows around the Hawaiian Islands. The
model ocean in this case is forced by the monthly, climatological wind of
Hellerman and Rosenstein (1983)
. Dashed contours denote the 200-m isobaths; areas shallower than 200 m are considered land in the model.
Click on thumbnail for full-sized image.
Fig. 8. Comparisons of cross-transect velocity profiles. Crosses denote the profile from the multiyear ADCP measurements (see Fig. 3 ,
averaged in the upper layer of 280 m). The solid (dashed) line denotes the
annually averaged upper-layer velocity profile from the time-varying (mean)
forcing case. The transect is located north of the island of Oahu, as indicated
in Fig. 1 .
Click on thumbnail for full-sized image.
Fig.
9. Upper-layer thickness anomalies along 21°N as a function of longitude
and model days. Contour intervals are 5 m and the gap around 156°W denotes
the island of Maui. Results from the base model case.
Click on thumbnail for full-sized image.
Fig.
10. Root-mean-squared sea surface height anomaly fields from (a) the base
model case, (b) the first 3 years of TOPEX/POSEIDON altimeter data, and (c)
the mean forcing model case. In constructing (b) to suppress small-scale
instrument noise, the original alongtrack surface height data are low-pass
filtered with a half-power point at 52 km (see Qiu 1995
). The contour interval is 0.01 m in (a) and (b) and 0.0005 m in (c).
Click on thumbnail for full-sized image.
Fig. 11. Same as in Fig. 7 except, in this case, the model ocean is driven by the mean Hellerman and Rosenstein wind.
Click on thumbnail for full-sized image.
Fig.
12. Closed path TSRQ (dashed line) used in the application of Godfrey’s island
rule. Arrows denote the mean Hellerman and Rosenstein wind data that are
used in evaluating the net transport To according to Eq. (8).
Click on thumbnail for full-sized image.
Fig. 13. Per-unit-length, meridional transport profile, vh, along 21.7°N east of Oahu Island. The net meridional transport (8.6 Sv) consists of the contribution from the interior Sverdrup flow (11.9 Sv) and that from the western boundary current (3.3 Sv).
Corresponding author address:
Dr. Bo Qiu, Department of Oceanography, School of Ocean and Earth Science
and Technology, University of Hawaii at Manoa, 1000 Pope Road, Honolulu,
HI 96822.
E-mail: bo@soest.hawaii.edu
Tables
Table
1. Transport values (in Sv) along 21.7°N east of the Hawaiian Islands determined
from (a) the island rule according to Eqs. (8)–(10), (b) the model result
of the base case shown in Fig. 13, and (c) the multiyear ADCP measurement
of Firing (1996).