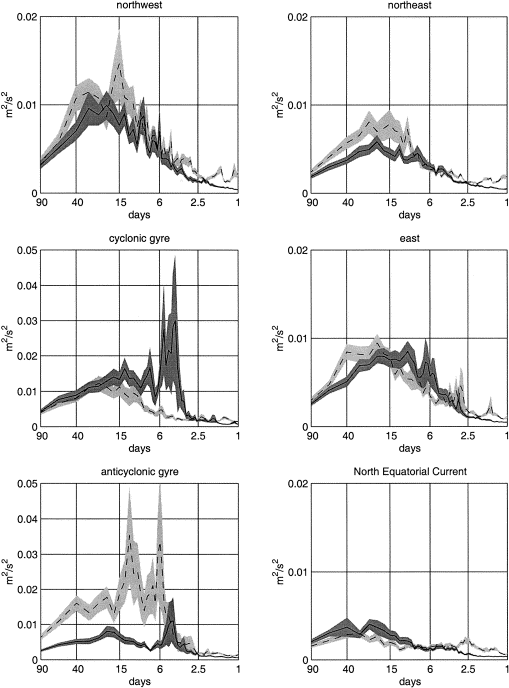
Fig. 6. Variance-preserving plots (frequency times energy density) of the Lagrangian cyclonic (solid, dark shading) and anticyclonic (dashed, light shading) spectra for the six groups. Shading indicates the standard error bars.